Calculations of Pressure drop in ECAL cooling circuits
20/07/01
=> Introduction
=> General layout
=> Values
=> File used for the calculations
This calculation is only preliminary, as we don't yet know the total path of the
circuit, especially in the vicinity of CMS.
Furthermore, the diameters and the flow are still subject to change.
However, this calculation can give us an idea of the range of head loss that we will find in the real circuit. The excel file used for the calculations, and given at the end of this document can be improved to take into account further modifications.
The cooling circuit of the Ecal sub-detector of CMS consist of two separated circuit.
One with a temperature stability required of ±0.05K (Regulating circuit) and the other
with usual requirements ±0.5K (Power circuit).
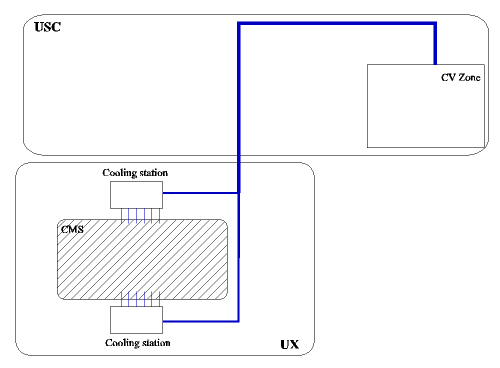
The path followed by both circuit is almost the same, as shown by the following schema.

There are two caverns underground. The Experimental cavern (UX) that will contain the
detector, with a reduced space. The service cavern (USC) designed to receive all service
(power, cooling, electronics...).
The cooling circuit will have a production zone (pump, heat exchangers, filters ...) in
the CV zone of the USC. One line will go from there to the UX. Once in the UX, this line
will split in 2 to feed the cooling station on each side of the detector. In the cooling
station, several lines goes inside the detector.
The pressure drop will be different on every line, but we will try to quantify these differences.
Power circuit
The lines coming and returning to the Cooling Station (CS) are of 2 types:
- DN10 0.166 l/s for the Barrel
- DN32 1.65 l/s for the Endcap
We have only considered the lines where we had the maximum pressure drop.
| Path | Pressure drop (bars) |
| Inside CV Zone | 0.8 |
| From CV zone to Cooling Station | 0.3 |
| Total USC to CS and return + CV zone |
1.3 |
| Lines inside CMS EE (max) | 3.1 |
| Lines inside CMS EB (max) | 1.7 |
Total (max) = 4.5 bars
Regulating circuit
The lines coming and returning to the Cooling Station (CS) are of 3 types:
- DN25 1.39 l/s for the Barrel
- DN25 0.98 l/s for the Endcap
- DN20 0.6 l/s for the Endcap
We have only considered the lines where we had the maximum pressure drop.
| Path | Pressure drop (bars) |
| Inside CV Zone | 0.8 |
| From CV zone to Cooling Station | 0.2 |
| Total USC to CS and return + CV zone |
1.1 |
| Lines inside CMS EE 1 (max) | 3.1 |
| Lines inside CMS EE 2 (max) | 3.7 |
| Lines inside CMS EB (max) | 1.8 |
Total (max) = 4.9 bars
Remark
The head loss on the Endcaps lines are higher than on the barrel. There is 3 main
reasons:
- the length of the path in bigger
- the pressure drop inside the Endcap sub-detector is not well known yet, so it has been
evaluated higher than on the barrel
- the flexible pipes that link the Endcaps to a fixed point have a very high pressure drop
compared to the normal pipes
File used for the calculations
Several parameters like number of elbows and length of the paths, also the approximations made.